
06 Jul The Outlook for Housing – RBA
RBA’s Head of Economic Analysis Department, Alexandra Heath, spoke at the Urban Development Institute of Australia, Wollongong and discussed housing, including some data on the Illawarra region.
Dwelling investment has gone from making a positive contribution to growth two years ago to being roughly flat over the year to March. In terms of our forecasts, dwelling investment is not expected to contribute much to growth over the next couple of years, but is expected to remain at a high level.
To understand the outlook, it is helpful to recognise that there isn’t a single national housing market. At the state level, there have been some similarities in the evolution of dwelling investment, but there have also been distinct differences (Graph 5).
Graph 5: Real Dwelling Investment
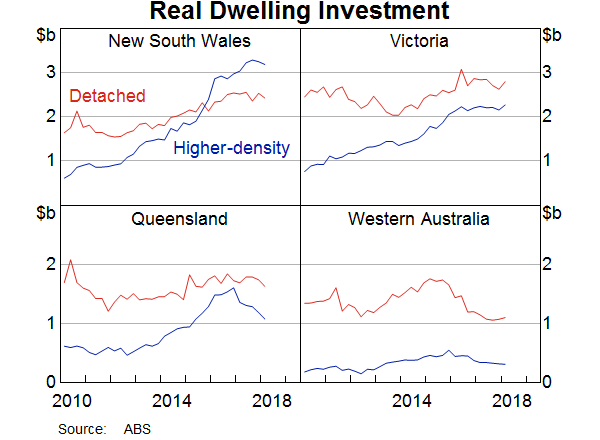
One point of similarity is that the construction of higher-density apartments has been much more important than in the past, especially in the east-coast capitals. We have used our liaison program quite extensively to understand how to adapt our forecasting processes to take into account that the time taken for a building approval to progress to construction and the period of construction is longer and more variable for high-density projects than for detached dwellings. The liaison program, which includes organisations such as the UDIA and its members, has also allowed us to gain deeper insights into specific local factors, such as differences in planning rules and the emergence of capacity constraints in the housing construction sector.
One point of difference across states has been the timing of dwelling investment cycles. For New South Wales and Victoria, the level of dwelling investment has been broadly stable at a high level since 2016. In contrast there has been a decline in higher-density construction in Queensland since early 2017. In Western Australia, residential construction peaked in mid 2015, which was well after the end of the mining boom. These differences highlight the fact that there are different demand and supply forces at work across the states. Given time constraints, I am going to focus my attention on the demand side of the market.
An important driver of housing demand over the long run is the rate at which new households are being formed. This depends on population growth and changes in the average number of people who are living in each household. Household size declined steadily in Australia between 1960 and 2000 before levelling out, alongside declines in marriage and fertility rates and population aging. The natural increase in the Australian population has also declined over time due to demographic factors. In particular, lower fertility rates have offset increased life expectancy (Graph 6). Having said that, the rate of natural increase in Australia’s population remains higher than in most other advanced economies.
Graph 6: Population Growth
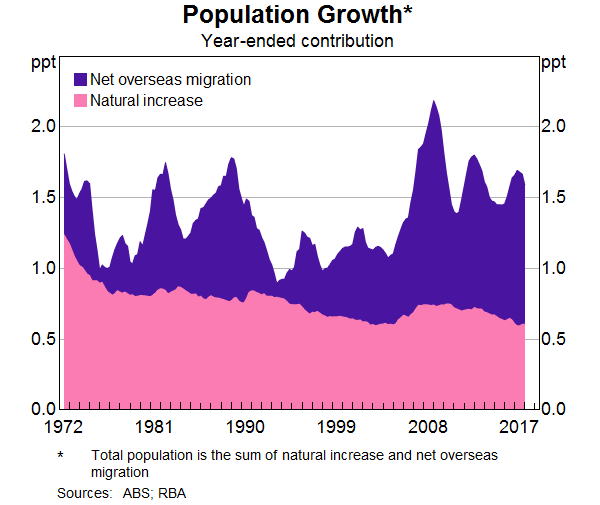
Immigration has also been a feature of the population growth story and it has certainly been the dominant influence on the swings in population growth over the past decade. The largest single category of net overseas migration has been people on temporary student visas (Graph 7). Prior to the financial crisis, a large share of these students were coming to Australia for vocational training courses. Following changes to visa requirements, student visa numbers initially dropped, but have picked up again in recent years, mostly due to an increase in students attending university. To put this into perspective, education now accounts for around 10 per cent of Australia’s total exports, which is in the same ball park as our rural exports. From the perspective of demand for housing, the important point is that most of these students have gone to Sydney and Melbourne.
Graph 7: Net Overseas Migration
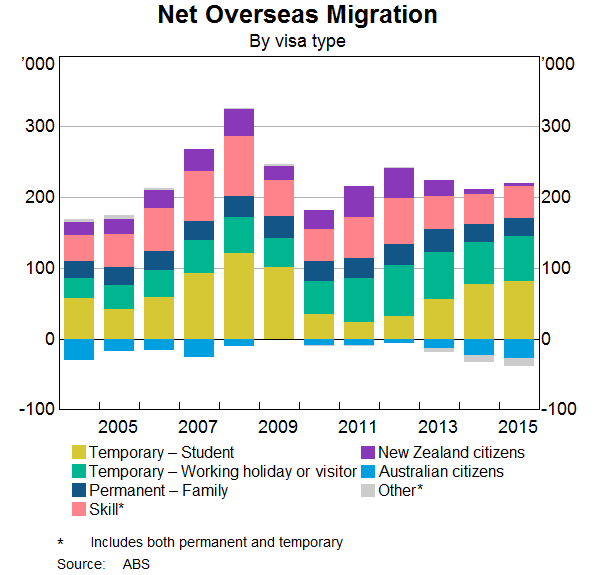
Another interesting category is skilled workers. The net inflow of people on skill visas increased in response to demand for workers during the mining boom. Most of these workers went to Western Australia and Queensland. At the same time, net migration to Western Australia and Queensland from other states and New Zealand also increased. As the mining sector transitioned from the construction to the production phase of the mining boom, the demand for labour fell. The number of people on skilled visas fell and the inflow of people from New Zealand and other Australian states turned to an outflow.
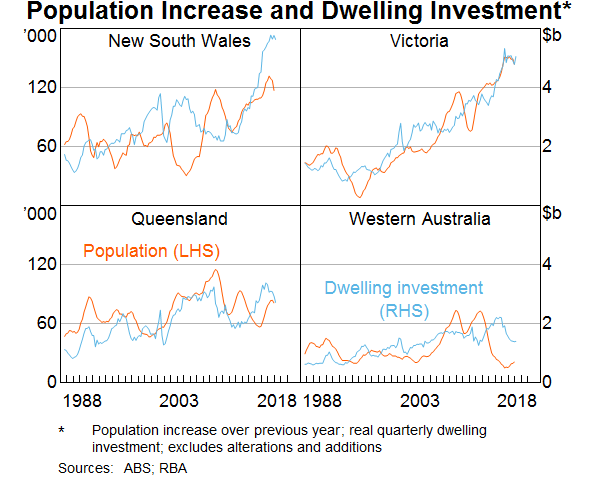
As a consequence, there have been quite large differences in population growth at the state level, which have had direct effects on the demand for housing (Graph 8). Population growth is expected to remain strong, particularly in Victoria and New South Wales, and the net overseas migration component of this is expected to be driven by people on student visas.
Graph 8: Population Increase and Dwelling Investment
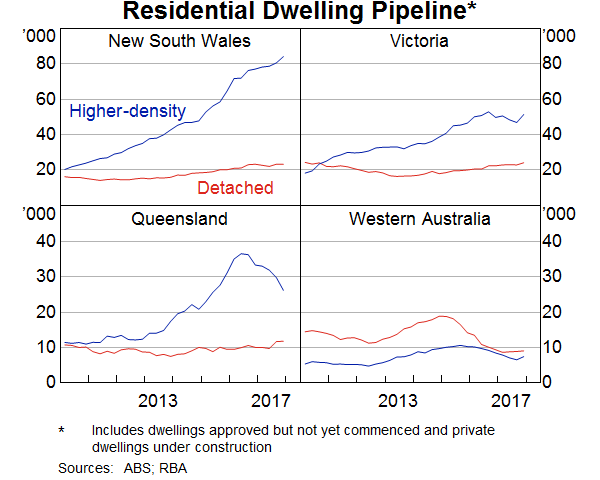
On the supply side, the pipeline of residential construction that has been approved, but not completed remains high in New South Wales and Victoria (Graph 9). There is also a reasonable pipeline of work in Queensland, although it has already started to decline. Based on recent approvals data and expected demand conditions, this suggests that dwelling investment in New South Wales and Victoria will remain at a high level for a number of years. Liaison contacts have suggested to us that capacity constraints in the construction industry, particularly in New South Wales, will make it difficult for construction activity to increase.
Graph 9: Residential Dwelling Pipeline
Of course household formation and population growth are not the only drivers of housing demand. For example, interest rates and changes in lending standards can also influence how much households are willing and able to spend on housing. Another way to gauge the current balance of housing supply and demand is to look at housing price growth.
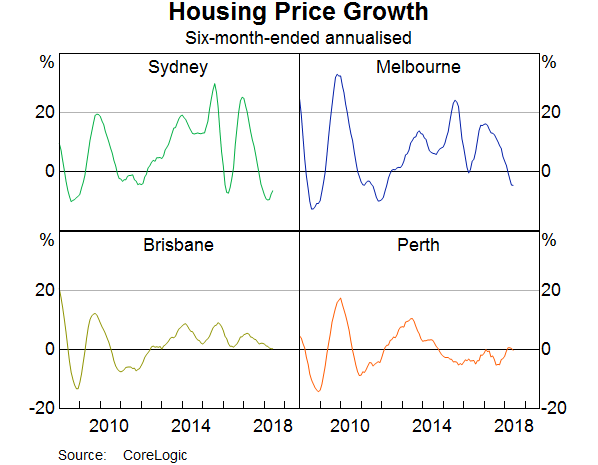
Over the past five years, housing price growth has been subdued in Brisbane and Perth (Graph 10). This is consistent with the fall in population growth coinciding with an increase in the supply of housing. In contrast, housing price growth has been strong until recently in Sydney and Melbourne, where population growth has been strong. Given that housing accounts for around 55 per cent of total household assets, we are paying close attention to these developments.
Graph 10: Housing Price Growth
The Housing Market in the Illawarra Region
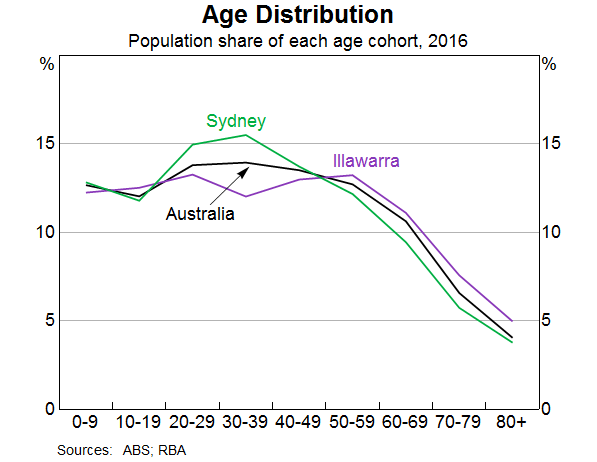
From a demand perspective, the Illawarra region has experienced a pick-up in population growth. Some of this has come from overseas students attending the University of Wollongong, and some has come from people migrating to the Illawarra region from Sydney. Although the Illawarra region is a little older, on average, than the rest of Australia and Sydney, it still has a large working-age population (Graph 11).
Graph 11: Age Distribution
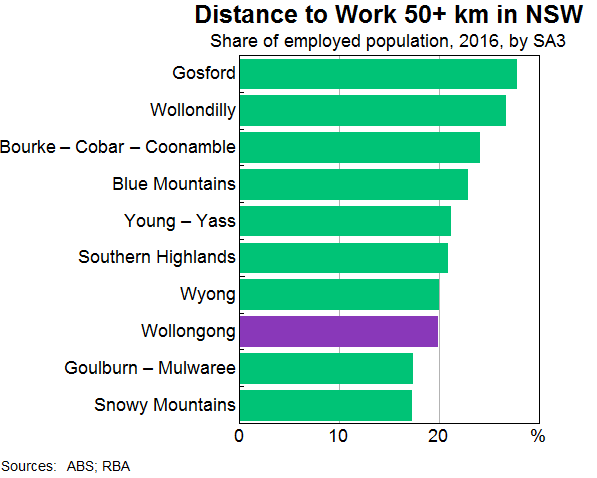
This is partly because its geographic proximity and transport infrastructure allow people living in Wollongong and the Illawarra region to commute to Sydney. Around 20 per cent of Wollongong workers commute at least 50 kilometres to work (Graph 12). This is one of the highest rates in the state. Unsurprisingly, five of the seven areas with higher shares of people commuting more than 50 kilometres are also within commuting distance of Sydney. Illawarra residents are also well placed to benefit from the fact that some of the fastest growing areas of Sydney are in south and south-west, including the proposed “aerotropolis” around the new airport at Badgery’s Creek. Access to these growth areas will be enhanced if some of the recently announced transport infrastructure plans are realised.
Graph 12: Distance to Work 50+ km in NSW
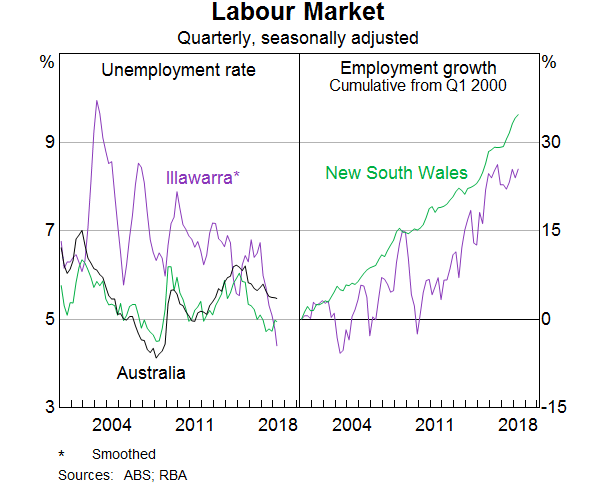
Although people from the Illawarra region can and do commute to Sydney, labour market conditions in the Illawarra region itself have also been strong recently (Graph 13). In combination, these factors mean that there has been strong employment growth for those living in the Illawarra region over the past five years and the unemployment rate is close to the average for New South Wales, which is, in turn, lower than the Australian unemployment rate.
Graph 13: Labour Market
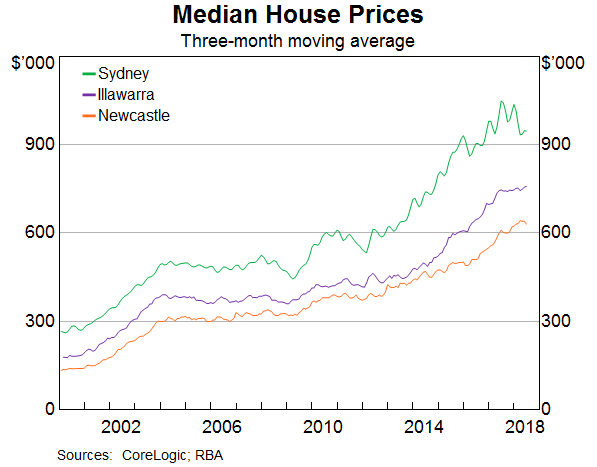
Strong population growth and the economic prosperity associated with strong labour market outcomes have led to higher housing prices in the Illawarra region (Graph 14). Just as in Sydney, developers have responded to the higher prices, and dwelling investment in the region has increased. Also similarly to Sydney, there has been a debate about whether the infrastructure has been growing fast enough to accommodate the needs of an expanding population and the increase in construction that goes with that.
Graph 14: Median House Prices
Conclusion
In summary, over the past couple of years, non-mining business investment has become a more important driver of growth in the Australian economy. This is a good thing because investment of this kind is necessary to ensure future productivity growth, which is ultimately what contributes to the economic prosperity and welfare of the Australian people. Infrastructure investment has been a part of this story.
At the same time, dwelling investment growth has eased off. Although dwelling investment is still expected to remain at a high level, particularly in New South Wales and Victoria, it is not likely to contribute much to growth over the next couple of years. Demand for housing remains strong because population growth is expected to stay strong. However, the housing story is different across states and across regions within states, partly because population trends differ. The effects of the mining investment cycle on population trends and housing markets in Western Australia is a clear-cut illustration of this point.
The data show that population trends and housing market developments in the Illawarra region are closely linked to those in Sydney, partly because the transport infrastructure allows people to live in the Illawarra region and commute to Sydney. Future transport infrastructure plans and the development associated with the Badgery’s Creek airport are likely to strengthen these ties. As always, the key to effective urban development is high-quality, transparent cost-benefit analysis of potential infrastructure projects informed by local knowledge. The UDIA has an important role to play here. The UDIA and its members, in Wollongong and elsewhere, also have an important role to play in macroeconomic policy by informing the Bank’s understanding of the factors at play in different housing markets through our liaison program.

